SCENARIO 19-3 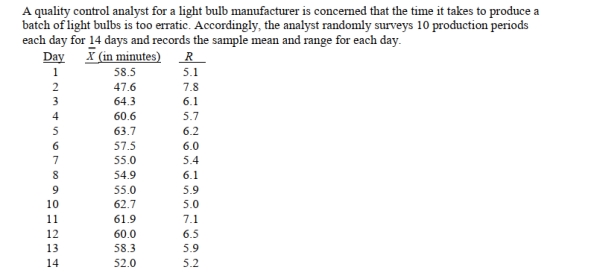
-Referring to Scenario 19-3, suppose the analyst constructs an R chart to see if the variability in
Production times is in-control.What is the lower control limit for this R chart?
A) 4.84
B) 3.37
C) 2.98
D) 1.34
Correct Answer:
Verified
Q1: Variation signaled by individual fluctuations or patterns
Q3: SCENARIO 19-2
A political pollster randomly selects a
Q4: One of the morals of the red
Q5: SCENARIO 19-2
A political pollster randomly selects a
Q6: The control chart
A)focuses on the time dimension
Q7: SCENARIO 19-2
A political pollster randomly selects a
Unlock this Answer For Free Now!
View this answer and more for free by performing one of the following actions

Scan the QR code to install the App and get 2 free unlocks

Unlock quizzes for free by uploading documents