Multiple Choice
SCENARIO 19-3 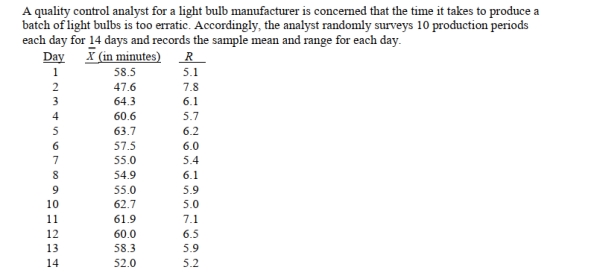
-Referring to Scenario 19-3, suppose the analyst constructs an R chart to see if the variability in
Production times is in-control.The R chart is characterized by which of the following?
A) Increasing trend
B) Decreasing trend
C) In-control
D) Points outside the control limits
Correct Answer:
Verified
Related Questions
Q33: SCENARIO 19-4 Q34: True or False: Special or assignable causes Q35: True or False: The control limits are![]()

