SCENARIO 17-3
The tree diagram below shows the results of the classification tree model that has been constructed to
predict the probability of a cable company's customers who will switch ("Yes" or "No")into its
bundled program offering based on the price ($30, $40, $50, $60)and whether the customer spends
more than 5 hours a day watching TV ("Yes" or "No")using the data set of 100 customers collected
from a survey. 
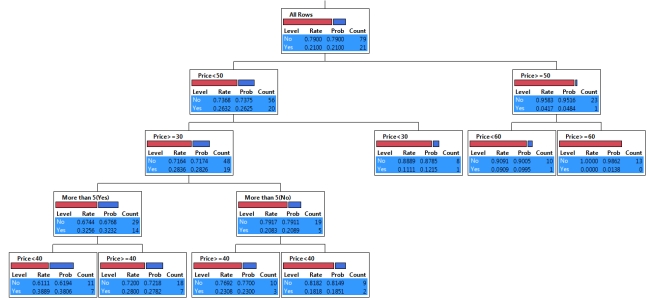
-True or False: Referring to Scenario 17-3, the highest probability of switching is predicted to
occur among customers who watch more than 5 hours of TV a day and are offered the bundled
price of between $30 and $40.
Correct Answer:
Verified
Q42: True or False: Data mining is used
Q43: True or False: The LogWorth statistic is
Q44: True or False: The result of the
Q45: True or False: The Akaike information criteria
Q46: True or False: Successful implementation of a
Q48: True or False: Data mining uses various
Q49: True or False: The G 2 statistic
Q50: True or False: The Akaike information criteria
Q51: True or False: In a regression tree,
Q52: True or False: Classification tree is not
Unlock this Answer For Free Now!
View this answer and more for free by performing one of the following actions

Scan the QR code to install the App and get 2 free unlocks

Unlock quizzes for free by uploading documents