The table shows the number of each car sold in the United States in June. Suppose the
sales record for one of these cars is randomly selected and the type of car is identified. 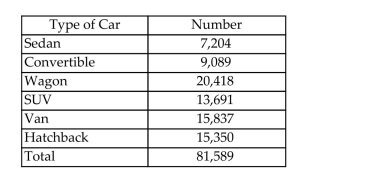 a. List the sample points for this experiment.
b. Find the probability of each sample point.
c. What is the probability that the car was a Van or an SUV?
Correct Answer:
Verified
View Answer
Unlock this answer now
Get Access to more Verified Answers free of charge
Q55: In an exit poll, 45% of voters
Q56: n = 2, N = 10
A)45
B)19
C)8
D)90
Q57: At a certain university, one out
Q58: Two chips are drawn at random
Q59: The data show the total number
Unlock this Answer For Free Now!
View this answer and more for free by performing one of the following actions

Scan the QR code to install the App and get 2 free unlocks

Unlock quizzes for free by uploading documents