The box plot shown below displays the amount of soda that was poured by a filling machine into 12-ounce soda cans at a local bottling company. 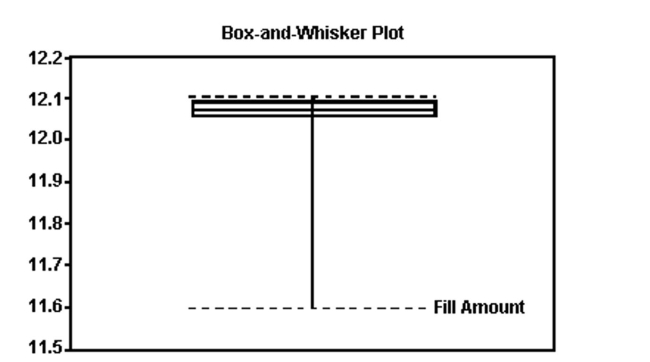 Based on the box plot, what shape do you believe the distribution of the data to have?
A) approximately symmetric
B) skewed to the left
C) skewed to the right
D) skewed to the center
Correct Answer:
Verified
Q169: At the U.S. Open Tennis Championship a
Q170: A radio station claims that the amount
Q171: Box plots are used to detect outliers
Q172: The data below represent the numbers
Q173: An outlier in a data set may
Q175: The amount of television viewed by todayʹs
Q176: The box plot shown below was constructed
Q177: A sociologist recently conducted a survey
Q178: The following data represent the scores
Q179: A sample of professional golfers was taken
Unlock this Answer For Free Now!
View this answer and more for free by performing one of the following actions

Scan the QR code to install the App and get 2 free unlocks

Unlock quizzes for free by uploading documents