The box plot shown below was constructed for the amount of soda that was poured by a filling machine into 12-ounce soda cans at a local soda bottling company. 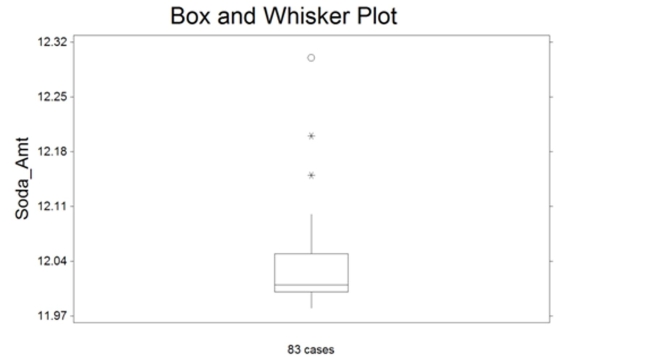 We see that one soda can received 12.15 ounces of soda on the plot above. Based on the box plot
Presented, how would you classify this observation?
A) highly suspect outlier
B) it has a lot of soda
C) suspect outlier
D) expected observation
Correct Answer:
Verified
Q158: Suppose that 50 and 75 are two
Q159: Which of the following statements could be
Q160: The z-score for a value x is
Q161: The z-score uses the quartiles to identify
Q162: For a given data set, the lower
Q164: An outlier may be caused by accidentally
Q165: Use a graphing calculator or software
Q166: The calculator screens summarize a data set.
Q167: The following data represent the scores
Q168: An outlier is defined as any observation
Unlock this Answer For Free Now!
View this answer and more for free by performing one of the following actions

Scan the QR code to install the App and get 2 free unlocks

Unlock quizzes for free by uploading documents