The contingency table below shows the results of a random sample of 200 state representatives that was conducted to see whether their opinions on a bill are related to their party affiliations.
Assuming the row and column classifications are independent, find an estimate for the expected cell count .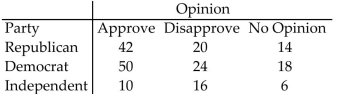
A)
B)
C)
D)
Correct Answer:
Verified
Q25: A teacher finds that final grades
Q26: A multinomial experiment with k =
Q27: Inc. Technology reported the results of
Q28: Test the null hypothesis of independence
Q29: Find the rejection region for a
Q31: A random sample of 160 car
Q32: A survey of entrepreneurs focused on
Q33: A sports researcher is interested in
Q34: A drug company developed a honey-based
Q35: Inc. Technology reported the results of
Unlock this Answer For Free Now!
View this answer and more for free by performing one of the following actions

Scan the QR code to install the App and get 2 free unlocks

Unlock quizzes for free by uploading documents