Suppose that the following model was fit to a set of data.
The corresponding plot if residuals against predicted values is shown. Interpret the plot.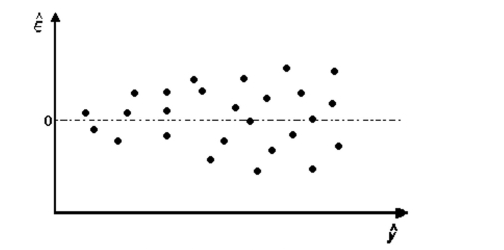
A) It appears that the variance of is not constant.
B) It appears that the data contain an outlier.
C) The residuals appear to be randomly scattered so that no model modifications are necessary.
D) It appears that a quadratic model would be a better fit.
Correct Answer:
Verified
Q108: The first-order model below was fit
Q109: The model Q110: Stepwise regression is used to determine which Q111: There are four independent variables, Q112: For any given model fit to a Q114: The stepwise regression procedure may not be Q115: Residual analysis can be used to check Q116: A regression residual is the difference between Q117: A collector of grandfather clocks believes Q118: A public health researcher wants to
Unlock this Answer For Free Now!
View this answer and more for free by performing one of the following actions

Scan the QR code to install the App and get 2 free unlocks

Unlock quizzes for free by uploading documents