The bar graph shows the expenditures of one city government in a recent year. Use the graph to answer the question. 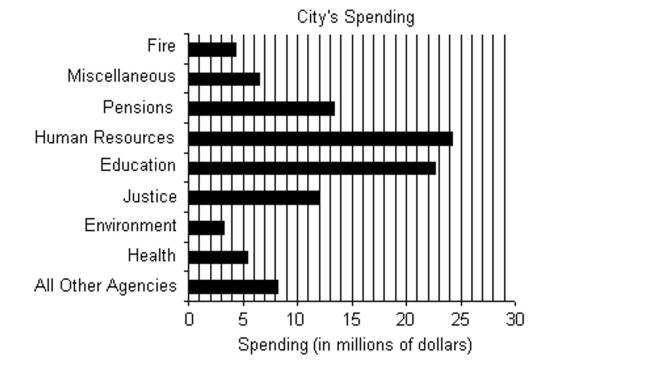
-Name the agency with the largest spending and estimate this value.
A) Human Resources; $24.2 million
B) Environment; million
C) Pensions; $13.4 million
D) Miscellaneous; million
Correct Answer:
Verified
Q300: Find an equation for the line.
Q301: The line graph shows the recorded
Q302: Determine whether the graph is the graph
Q303: Write the word or phrase that best
Q304: Find the domain and range of
Q306: Find the indicated function values.
-If
Q307: Find the domain and range of
Q308: The bar graph shows the expenditures
Q309: The line graph shows the recorded hourly
Q310: Provide an appropriate response.
-If
Unlock this Answer For Free Now!
View this answer and more for free by performing one of the following actions

Scan the QR code to install the App and get 2 free unlocks

Unlock quizzes for free by uploading documents