Multiple Choice
Construct a dotplot for the following data.
A) 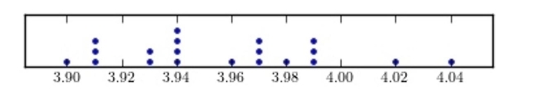
B) 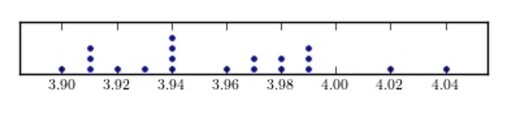
C) 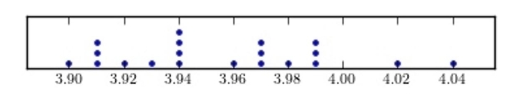
D) 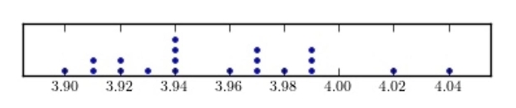
Correct Answer:
Verified
Related Questions
Q90: A Pareto chart is useful for showing
Q91: A weatherman records the amount of rain
Q92: Which graph should be used to represent
Unlock this Answer For Free Now!
View this answer and more for free by performing one of the following actions

Scan the QR code to install the App and get 2 free unlocks

Unlock quizzes for free by uploading documents