Which set of data represented by the three histograms below most likely came from a normal distribution?
A) 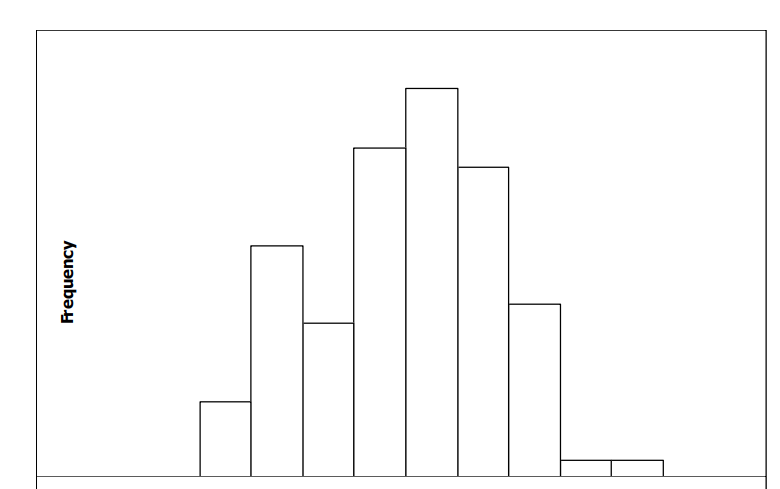
B) 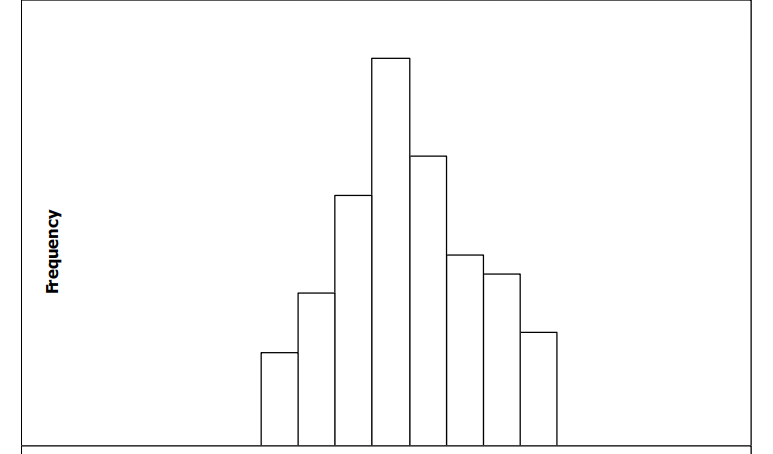
C) 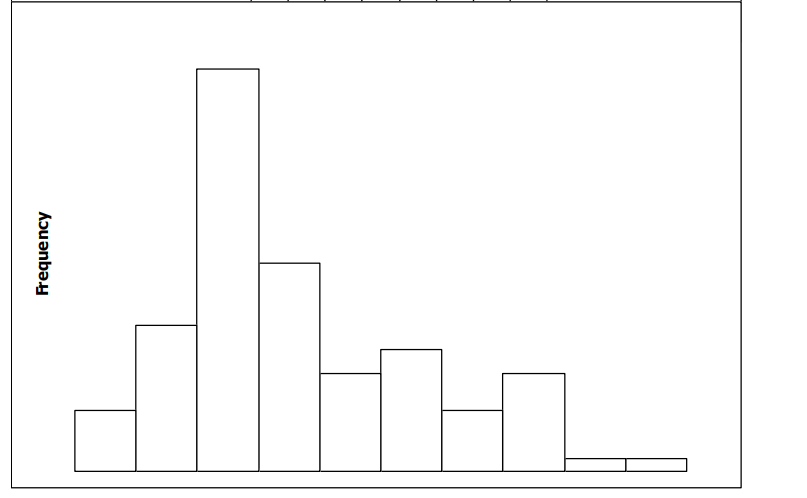
Correct Answer:
Verified
Q16: The annual precipitation amounts in a certain
Q17: Select the distribution that appears to be
Q18: If light bulbs have lives that are
Q19: The annual precipitation for one city is
Q20: The lifetimes of light bulbs of a
Q22: The scores on a certain test are
Q23: Decide which of the described variables is/are
Q24: Standard used car prices are based on
Q25: Assume that women have heights that are
Q26: Which one of the three variables below
Unlock this Answer For Free Now!
View this answer and more for free by performing one of the following actions

Scan the QR code to install the App and get 2 free unlocks

Unlock quizzes for free by uploading documents