Find the area of the shaded region. The graph depicts the standard normal distribution with mean 0 and standard deviation 1.
-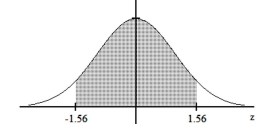
A) 0.1188
B) 0.8812
C) 0.0594
D) 0.9406
Correct Answer:
Verified
Q121: Estimate the indicated probability by using the
Q122: In a continuous uniform distribution,
Q123: Assume that the weight loss for
Q124: If z is a standard normal variable,
Q125: Estimate the indicated probability by using the
Q127: A bank's loan officer rates applicants for
Q128: Assume that adults have IQ scores
Q129: Use the normal distribution to approximate the
Q130: The diameters of pencils produced by a
Q131: A study of the amount of time
Unlock this Answer For Free Now!
View this answer and more for free by performing one of the following actions

Scan the QR code to install the App and get 2 free unlocks

Unlock quizzes for free by uploading documents