Find the area of the shaded region. The graph depicts IQ scores of adults, and those scores are normally distributed with a mean of 100 and a standard deviation of 15 (as on the Wechsler test) . 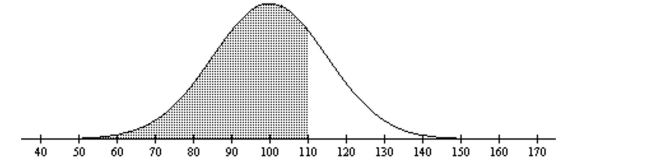
A) 0.7486
B) 0.6293
C) 0.8051
D) 0.4400
Correct Answer:
Verified
Q168: A final exam in Math 160 has
Q169: In one region, the September energy
Q170: The Precision Scientific Instrument Company manufactures
Q171: Using the following uniform density curve, answer
Q172: If selecting samples of si
Q174: Assume that adults have IQ scores that
Q175: Assume that the weights of quarters are
Q176: For women aged 18-24, systolic blood pressures
Q177: The weights of the fish in a
Q178: Find the indicated z score. The graph
Unlock this Answer For Free Now!
View this answer and more for free by performing one of the following actions

Scan the QR code to install the App and get 2 free unlocks

Unlock quizzes for free by uploading documents