Find the area of the shaded region. The graph depicts the standard normal distribution with mean 0 and standard
deviation 1.
-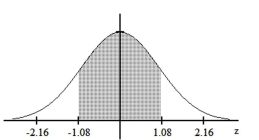
A) 0.7198
B) 0.1401
C) 0.2802
D) 0.8599
Correct Answer:
Verified
Q141: Find the indicated probability.
-The weekly salaries of
Q178: Find the indicated z score. The graph
Q180: A study of the amount of time
Q181: Using the following uniform density curve, answer
Q182: The Precision Scientific Instrument Company manufactures thermometers
Q184: Samples of size n = 900 are
Q185: The given values are discrete. Use the
Q186: Estimate the indicated probability by using
Q187: Estimate the indicated probability by using the
Q188: A final exam in Math 160 has
Unlock this Answer For Free Now!
View this answer and more for free by performing one of the following actions

Scan the QR code to install the App and get 2 free unlocks

Unlock quizzes for free by uploading documents