A television manufacturer sold three times as many televisions in 2005 as it did in 1995. To illustrate this fact, the manufacturer draws a graph as shown below. The television on the right is three times as tall and three times as wide as the television on the left. Why is this graph misleading? What visual impression is created by the graph? 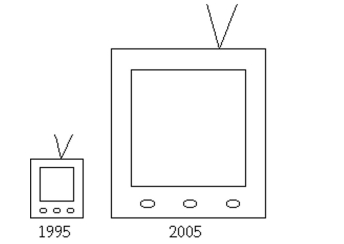
Correct Answer:
Verified
View Answer
Unlock this answer now
Get Access to more Verified Answers free of charge
Q7: A medical research team studied the
Q8: The data shows the roundtrip mileage
Q10: In a survey, 20 people were
Q11: A college student wants to purchase one
Q13: On a math test, the scores
Q14: In a survey, 26 voters were
Q15: Suppose that a histogram is constructed
Q16: One purpose of displaying data graphically
Q54: Describe at least two advantages to using
Q59: Explain in your own words why a
Unlock this Answer For Free Now!
View this answer and more for free by performing one of the following actions

Scan the QR code to install the App and get 2 free unlocks

Unlock quizzes for free by uploading documents