The histogram below represents the number of television sets per household for a sample of U.S. households. How many households are included in the histogram? 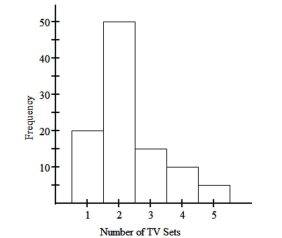
A) 100
B) 110
C) 95
D) 90
Correct Answer:
Verified
Q39: Consider the frequency distribution below, which
Q40: Q41: Construct the cumulative frequency distribution that Q42: A manufacturer records the number of Q43: The frequency distribution below summarizes the Q45: The attendance counts for this season's Q46: The following frequency distribution analyzes the Q47: The frequency distribution below summarizes employee Q48: The midterm test scores for the Q49: The normal monthly precipitation (in inches)
Unlock this Answer For Free Now!
View this answer and more for free by performing one of the following actions

Scan the QR code to install the App and get 2 free unlocks

Unlock quizzes for free by uploading documents