Wagenlucht Ice Cream Company is always trying to create new flavors of ice cream. They are market testing three kinds to find out which one has the best chance of becoming popular. They give small samples of each to 40 people at a grocery store. 8 ice cream tasters preferred the strawberry Cream, 24 preferred Choco-Nuts, and 8 loved the Orange Mint. Construct a Pareto chart to represent these preferences. Choose the vertical scale so that the relative frequencies are represented. 
A) 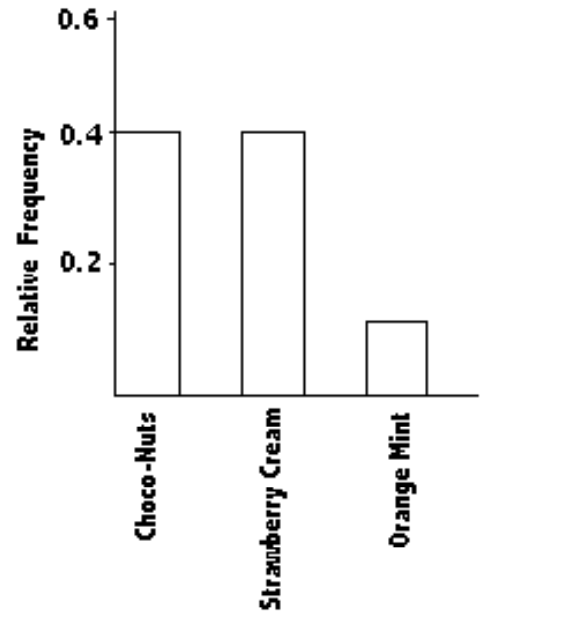
B) 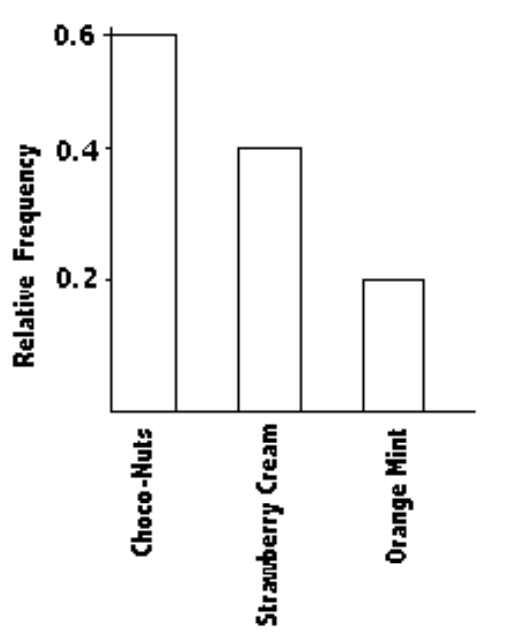
C) 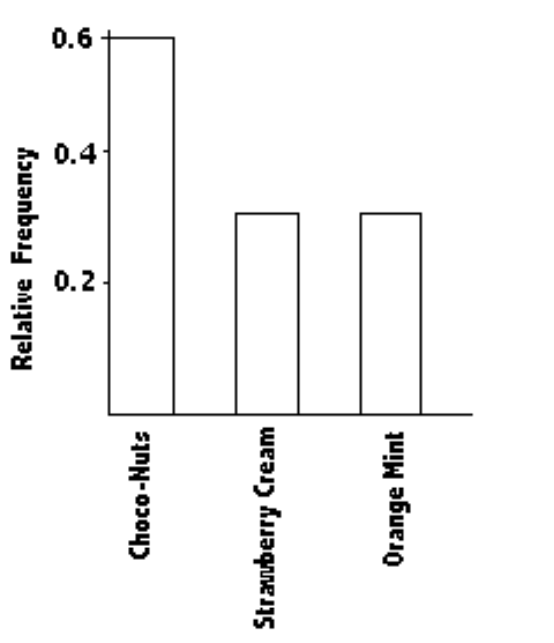
D) 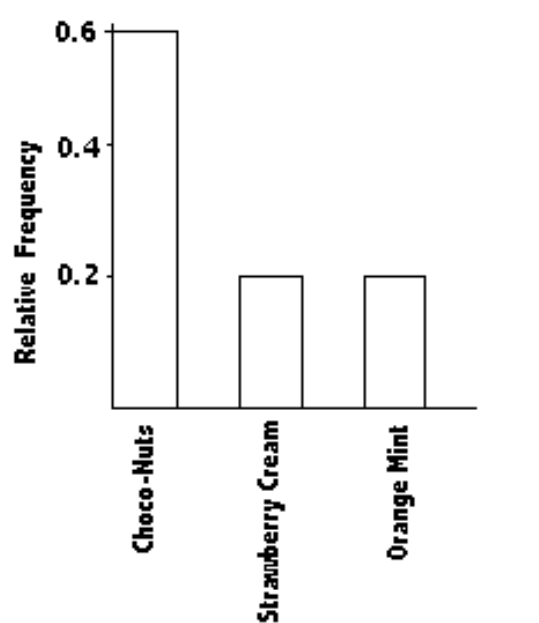
Correct Answer:
Verified
Q59: The frequency distribution below summarizes employee
Q60: A nurse measured the blood pressure of
Q61: A nurse measured the blood pressure of
Q62: The Kappa Iota Sigma Fraternity polled its
Q63: The scores on a recent statistics
Q65: The frequency distribution below summarizes employee
Q66: The following frequency distribution analyzes the
Q67: The following data show the number
Q68: The histogram below represents the number of
Q69: The frequency distribution for the weekly
Unlock this Answer For Free Now!
View this answer and more for free by performing one of the following actions

Scan the QR code to install the App and get 2 free unlocks

Unlock quizzes for free by uploading documents