Homelessness is a problem in many large U.S. cities. To better understand the problem, a
multiple regression was used to model the rate of homelessness based on several
explanatory variables. The following data were collected for 50 large U.S. cities. The
regression results appear below. 
Unemployment percent of residents unemployed
Temperature average yearly temperature (in degrees F.)
Vacancy percent of housing that is unoccupied
Rent Control indicator variable, city has rent control, no rent control
Dependent variable is Homeless
squared squared (adjusted)
with degrees of freedom
a. Using a 5% level of significance, which variables are associated with the number of
homeless in a city?
b. Explain the meaning of the coefficient of temperature in the context of this problem.
c. Explain the meaning of the coefficient of rent control in the context of this problem.
d. Do the results suggest that having rent control laws in a city causes higher levels of
homelessness? Explain.
e. If we created a new model by adding several more explanatory variables, which statistic
should be used to compare them - the R2 or the adjusted R2 ? Explain.
f. Using the plots below, check the regression conditions. 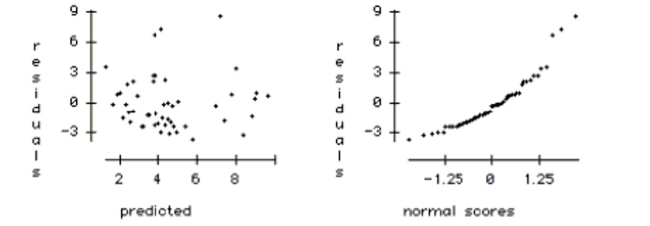
Correct Answer:
Verified
Q1: In ANOVA, an interaction between two factors
Q3: In regression an observation has high leverage
Q4: Check the conditions for the regression and
Q5: Engineers want to know what factors
Q6: Here are data about the average
Q7: In ANOVA, the Bonferroni method is used
Q8: To discourage cheating, a professor makes
Q10: Which of the following are NOT
Q11: The problem of collinearity occurs when
A) at
Q32: Of the 23 first year male
Unlock this Answer For Free Now!
View this answer and more for free by performing one of the following actions

Scan the QR code to install the App and get 2 free unlocks

Unlock quizzes for free by uploading documents