The regression below predicts the daily number of skiers who visit a small ski resort based on three explanatory variables.
The data is a random sample of 30 days from the past two ski seasons. The variables are: SKIERS the number of skiers who visit the resort on that day
SNOW the number of inches of snow on the ground
TEMP the high temperature for the day in degrees .
WEEKDAY an indicator variable, weekday , weekend
Dependent variable is Skiers
R squared squared (adjusted)
with degrees of freedom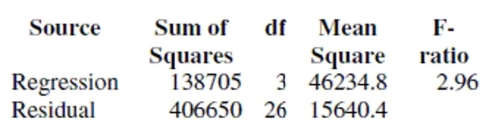
-If you think that the temperature might affect attendance differently on weekends than on
weekdays, how would you change the regression to test this?
Correct Answer:
Verified
View Answer
Unlock this answer now
Get Access to more Verified Answers free of charge
Q13: Here are data about the average January
Q14: When a sum of squares is divided
Q15: For a class project, students tested
Q17: Here are data about the average January
Q18: Of the 23 first year male
Q19: The regression below predicts the daily
Q20: The regression below predicts the daily
Q21: A student wants to build a
Q22: Here are data about the average
Q23: Here are data about the average
Unlock this Answer For Free Now!
View this answer and more for free by performing one of the following actions

Scan the QR code to install the App and get 2 free unlocks

Unlock quizzes for free by uploading documents