Poverty In a study of how the burden of poverty varies among U. S. regions, a random
sample of 1000 individuals from each region of the United States recently yielded the
information on poverty (based on defining the poverty level as an income below $10,400
for a family of 4 people). The data and calculation of the test statistic is shown in the table
below. (All the conditions are satisfied - don'ft worry about checking them.) 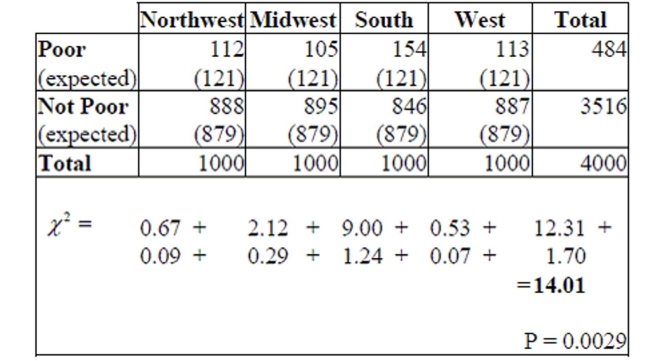
a. Write appropriate hypotheses.
b. Suppose the expected values had not been given. Show exactly how to calculate the
expected count in the first cell.
c. How many degrees of freedom are there?
d. State your complete conclusion in context.
Correct Answer:
Verified
View Answer
Unlock this answer now
Get Access to more Verified Answers free of charge
Q22: A San Jose State student collects
Q22: One common method of evaluating the
Q30: A San Jose State student collects
Q38: Create and interpret a 95% confidence interval.
Q64: When two competing teams are equally
Q66: Most people are definitely dominant on
Q67: Could eye color be a warning signal
Q68: Housing costs A government report on housing
Q71: In 2010, the United Nations claimed that
Q72: Test identification Suppose you were asked
Unlock this Answer For Free Now!
View this answer and more for free by performing one of the following actions

Scan the QR code to install the App and get 2 free unlocks

Unlock quizzes for free by uploading documents