The bigger the stop sign, the more expensive it is. Here is a graph of the height of a sign in inches versus its cost in dollars.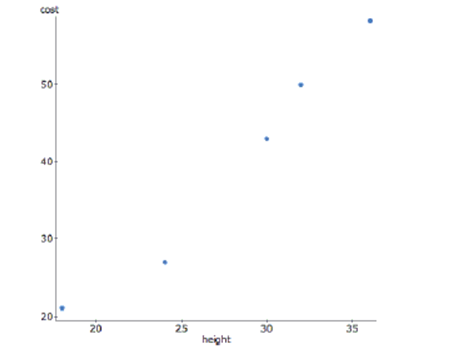
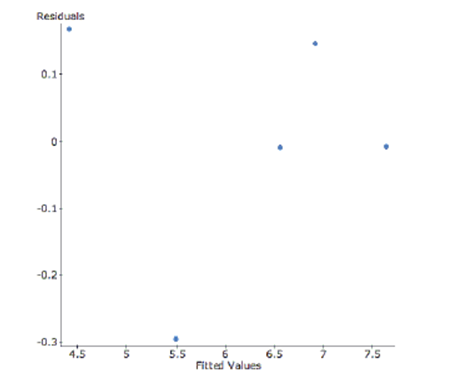
To achieve linearity, the data was transformed using a square root function of cost. Here are the results and a residual plot.
Dependent Variable:
(correlation coefficient)
s: 0.2141
-Interpret R-sq in the context of this problem.
Correct Answer:
Verified
View Answer
Unlock this answer now
Get Access to more Verified Answers free of charge
Q8: An article in the Journal of Statistics
Q77: Current research states that a good diet
Q78: A study examined the number of
Q79: Earning power A college's job placement office
Q81: Match each graph with the appropriate correlation
Q83: A study by a prominent psychologist found
Q84: A study examined the number of
Q85: One of your classmates is reading through
Q86: Assembly line Your new job at
Q87: On the axes below, sketch a scatterplot
Unlock this Answer For Free Now!
View this answer and more for free by performing one of the following actions

Scan the QR code to install the App and get 2 free unlocks

Unlock quizzes for free by uploading documents