Time Wasted A group of students decide to see if there is link between wasting time on the
internet and GPA. They don't expect to find an extremely strong association, but they're
hoping for at least a weak relationship. Here are the findings.
a. How strong is the relationship the students found? Describe in context with statistical
justification.
One student is concerned that the relationship is so weak, there may not actually be any
relationship at all. To test this concern, he runs a simulation where the 10 GPA's are
randomly matched with the 10 hours/week. After each random assignment, the correlation
is calculated. This process is repeated 100 times. Here is a histogram of the 100 correlations.
The correlation coefficient of -0.371 is indicated with a vertical line. 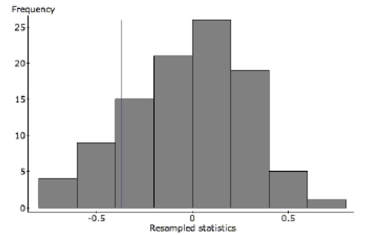
b. Do the results of this simulation confirm the suspicion that there may not be any
relationship? Refer specifically to the graph in your explanation.
Correct Answer:
Verified
View Answer
Unlock this answer now
Get Access to more Verified Answers free of charge
Q10: What is the correlation between cost and
Q13: Do you think a linear model is
Q62: A school board study found a moderately
Q96: Mistakes. Describe the mistake made in the
Q112: The bigger the stop sign, the
Q118: Penicillin Doctors studying how the human
Q119: During a science lab, students heated
Q120: You are given the following costs
Q121: An article in the Journal of
Q122: If you have a puppy who
Unlock this Answer For Free Now!
View this answer and more for free by performing one of the following actions

Scan the QR code to install the App and get 2 free unlocks

Unlock quizzes for free by uploading documents