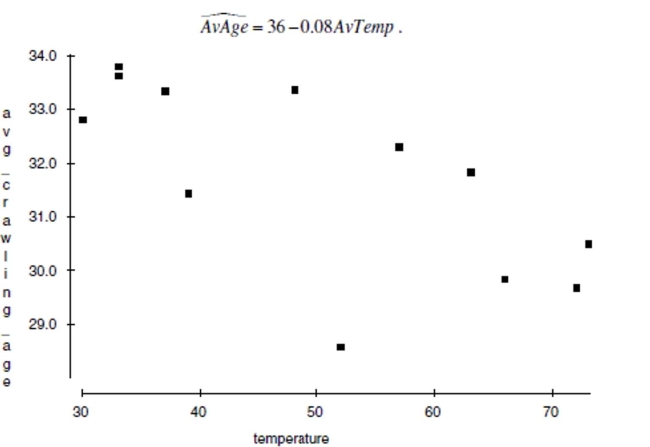
Crawling Researchers at the University of Denver Infant Study Center investigated
whether babies take longer to learn to crawl in cold months (when they are often bundled
in clothes that restrict their movement) than in warmer months. The study sought an
association between babies' first crawling age (in weeks) and the average temperature
during the month they first try to crawl (about 6 months after birth). Between 1988 and
1991 parents reported the birth month and age at which their child was first able to creep
or crawl a distance of four feet in one minute. Data were collected on 208 boys and 206
girls. The graph below plots average crawling ages (in weeks) against the mean
temperatures when the babies were 6 months old. The researchers found a correlation of r
= -0.70 and their line of best fit was 
a. Draw the line of best fit on the graph. (Show your method clearly.)
b. Describe the association in context.
c. Explain (in context) what the slope of the line means.
d. Explain (in context) what the y-intercept of the line means.
e. Explain (in context) what
means.
f. In this context, what does a negative residual indicate?
Correct Answer:
Verified
View Answer
Unlock this answer now
Get Access to more Verified Answers free of charge
Q6: Interpret the intercept of your model in
Q78: A study examined the number of
Q83: A study by a prominent psychologist found
Q100: In an effort to decide if
Q117: A study examined the number of
Q146: Penicillin assimilation Doctors studying how the
Q148: Match each graph with the appropriate correlation
Q149: The following scatterplot shows the relationship
Q154: Gas mileage again In the Data
Q155: After conducting a survey of his students,
Unlock this Answer For Free Now!
View this answer and more for free by performing one of the following actions

Scan the QR code to install the App and get 2 free unlocks

Unlock quizzes for free by uploading documents