The distribution below is the number of family members reported by 25 people in the 2010 Census.
The best description for the shape of this distribution is 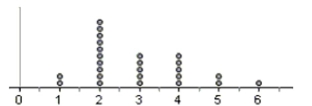
A) approximately normal
B) normal
C) bimodal
D) skewed right
E) skewed left
Correct Answer:
Verified
Q32: We collect these data from 50 male
Q33: If we want to discuss any gaps
Q34: Two sections of a class took the
Q35: The ages of people attending the opening
Q36: Suppose a Normal model describes the number
Q38: Which is true of the data whose
Q39: The advantage of making a stem-and-leaf display
Q40: To see if your school's ACT scores
Q42: The boxplots show the age of people
Q43: One of the reasons that the Monitoring
Unlock this Answer For Free Now!
View this answer and more for free by performing one of the following actions

Scan the QR code to install the App and get 2 free unlocks

Unlock quizzes for free by uploading documents