Health insurance The World Almanac and Book of Facts 2004 reported the percent of people not covered by health insurance in the 50 states and Washington, D.C., for the year 2002. Computer output gives these summaries for the percent of people not covered by health insurance:
a. Were any of the states outliers? Explain how you made your decision.
b. A histogram of the data is as follows: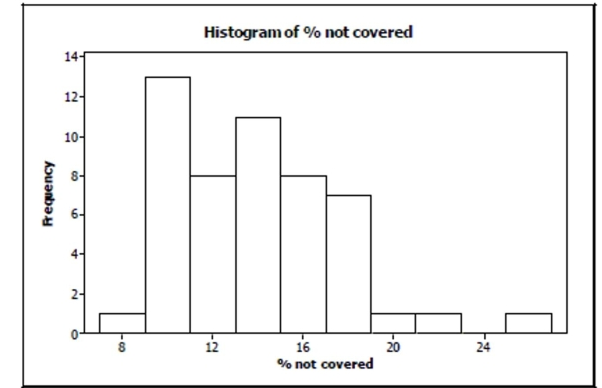
Is it more appropriate to use the mean and standard deviation or the median and IQR to
describe these data? Explain.
Correct Answer:
Verified
View Answer
Unlock this answer now
Get Access to more Verified Answers free of charge
Q40: To determine if people's preference in
Q42: The boxplots show the age of people
Q43: In November 2003 Discover published an article
Q43: In November 2003 Discover published an article
Q44: The five-number summary for the fuel
Q49: Has the percentage of young girls drinking
Q50: Copy machines A manufacturer claims that lifespans
Q55: A research company frequently monitors trends
Q58: A research company frequently monitors trends
Q61: A research company frequently monitors trends
Unlock this Answer For Free Now!
View this answer and more for free by performing one of the following actions

Scan the QR code to install the App and get 2 free unlocks

Unlock quizzes for free by uploading documents