Commuting to work The table shows how a company's employees commute to work. 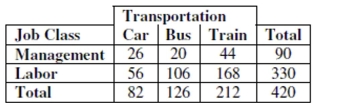
a. What is the marginal distribution (in %) of mode of transportation (Car, Bus, Train)?
b. What is the conditional distribution (in %) of mode of transportation (Car, Bus, Train) for
management?
c. What kind of display would you use to show the association between job class and mode
of transportation? (Just name a graph.)
d. Do job classification and mode of transportation appear to be independent? Give
statistical evidence to support your conclusion.
Correct Answer:
Verified
b. Car:
View Answer
Unlock this answer now
Get Access to more Verified Answers free of charge
Q3: Adult female Dalmatians weigh an average of
Q34: A research company frequently monitors trends
Q38: All students in a physical education class
Q59: One thousand students from a local university
Q60: The boxplots show prices of used cars
Q64: Soft drinks A restaurant owner wanted to
Q66: Owners of a minor league baseball team
Q68: Human body temperatures taken through the ear
Q79: A research company frequently monitors trends
Q87: Write a sentence or two about the
Unlock this Answer For Free Now!
View this answer and more for free by performing one of the following actions

Scan the QR code to install the App and get 2 free unlocks

Unlock quizzes for free by uploading documents