Auto insurance The Insurance Institute for Highway Safety publishes ratings for all
models of vehicles to compare the relative risk of payouts. 100 is the mean rating for all
vehicles. A rating of 122 means the vehicle is 22% worse than average. The table at the
right shows the summary statistics for the collision ratings of 27 midsize cars.
a. Were any of the ratings outliers? Show how you made your decision.
b. A histogram of the data is shown. Is it more appropriate to use the mean and standard
deviation, or the median and IQR to describe these data? Explain. 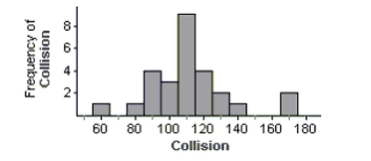
Correct Answer:
Verified
View Answer
Unlock this answer now
Get Access to more Verified Answers free of charge
Q4: To determine if people's preference in dogs
Q4: To determine if people's preference in dogs
Q12: Although most of us buy milk by
Q115: At a large business, employees must report
Q116: The students in a biology class
Q117: Paying for purchases One day a store
Q121: The following are histograms for the heights
Q122: Cats and dogs The table shows whether
Q123: The Postmaster of a city's Post Office
Q125: Nickels minted in the United States are
Unlock this Answer For Free Now!
View this answer and more for free by performing one of the following actions

Scan the QR code to install the App and get 2 free unlocks

Unlock quizzes for free by uploading documents