Taxi tires A taxi company monitoring the safety of its cabs kept track of the number of
miles tires had been driven (in thousands) and the depth of the tread remaining (in mm).
Their data are displayed in the scatterplot. They found the equation of the least squares regression line to be tread miles, with .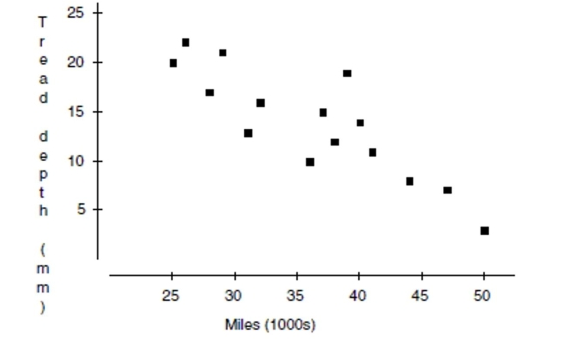
a. Draw the line of best fit on the graph. (Show your method clearly.)
b. What is the explanatory variable?
c. The correlation
d. Describe the association in context.
e. Explain (in context) what the slope of the line means.
f. Explain (in context) what the -intercept of the line means.
g. Explain (in context) what means.
h. In this context, what does a negative residual mean?
Correct Answer:
Verified
g. R2 means that 7...
View Answer
Unlock this answer now
Get Access to more Verified Answers free of charge
Q36: Medical records indicate that people with more
Q37: A regression analysis of company profits and
Q38: A least squares line of regression has
Q40: Crawling Researchers at the University of
Q42: Computer output in the scenario described
Q43: A regression equation is found that
Q45: Time Wasted A group of students
Unlock this Answer For Free Now!
View this answer and more for free by performing one of the following actions

Scan the QR code to install the App and get 2 free unlocks

Unlock quizzes for free by uploading documents