Health insurance The World Almanac and Book of Facts 2004 reported the percent of people
not covered by health insurance in the 50 states and Washington, D.C., for the year 2002.
Computer output gives these summaries for the percent of people not covered by health
insurance:
a. Were any of the states outliers? Explain how you made your decision.
b. A histogram of the data is as follows: 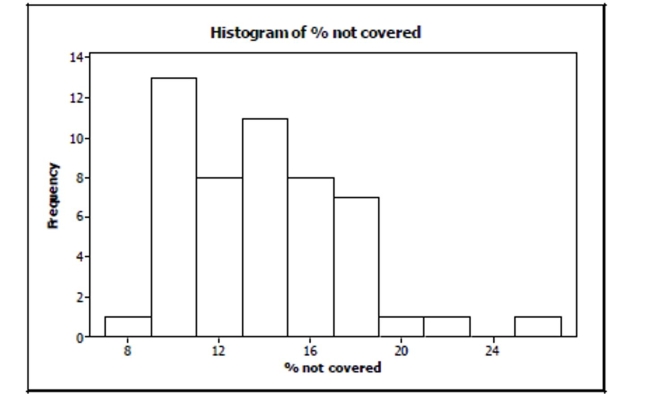
Is it more appropriate to use the mean and standard deviation or the median and IQR to
describe these data? Explain.
Correct Answer:
Verified
View Answer
Unlock this answer now
Get Access to more Verified Answers free of charge
Q73: Concrete thickness A roadway construction process uses
Q754: If we want to discuss any gaps
Q755: Suppose that a Normal model described
Q756: The veterinary bills for the dogs are
Q757: The advantage of making a stem-and-leaf display
Q758: Which is true of the data shown
Q760: The SPCA collects the following data about
Q762: Cellphones ConsumerReports.org evaluated the price and
Q763: The standard deviation of the data displayed
Q764: Suppose that a Normal model describes the
Unlock this Answer For Free Now!
View this answer and more for free by performing one of the following actions

Scan the QR code to install the App and get 2 free unlocks

Unlock quizzes for free by uploading documents