From the TI-84 graphing calculator screenshots below, choose the screenshot whose shaded area correctly depicts the following hypothesis test results: -value
A) 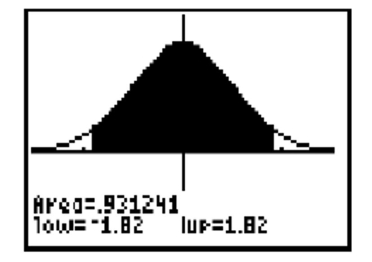
B) 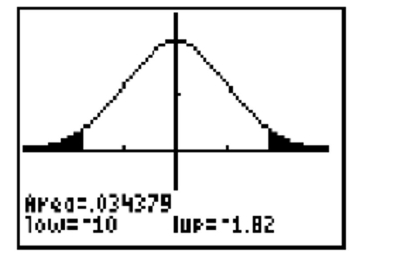
C) 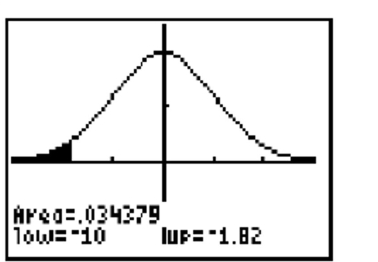
Correct Answer:
Verified
Q2: Which of the following is not a
Q4: To continue the study into the
Q5: From the TI-84 graphing calculator screenshots below,
Q5: Which statement best describes the power of
Q6: A researcher conducts a hypothesis test on
Q8: To continue the study into the
Q9: Which statement best describes the significance level
Q10: Check that the conditions hold so that
Q11: Suppose a city official conducts a hypothesis
Q12: Read the following then choose the appropriate
Unlock this Answer For Free Now!
View this answer and more for free by performing one of the following actions

Scan the QR code to install the App and get 2 free unlocks

Unlock quizzes for free by uploading documents