A group of junior high athletes was asked what team sport was their favorite. The data are summarized in the table below. On the pie chart, which area would correspond to the category
"Volleyball"? 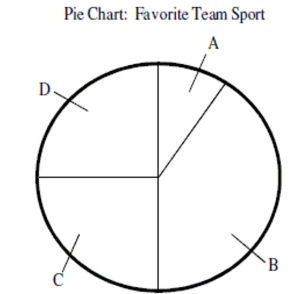
A) Area A
B) Area B
C) Area C
D) Area D
Correct Answer:
Verified
Q11: The distribution of test scores for a
Q12: A collection of twenty college students
Q13: A collection of twenty college students
Q14: Data were collected on hand grip strength
Q15: Each day for twenty days a record
Q17: The following graphic was used to visually
Q18: For twenty days a record store owner
Q19: Based on the histogram below, would it
Q20: Choose the histogram that matches the description.
-The
Q21: Choose the histogram that matches the description.
-The
Unlock this Answer For Free Now!
View this answer and more for free by performing one of the following actions

Scan the QR code to install the App and get 2 free unlocks

Unlock quizzes for free by uploading documents