A used car salesman decides to track the number of cars he sold each week for the past twelve months. Typically, the salesman sells 13 cars per week. During an usually slowweek he sold only 2 cars, but during his best week he sold 29 cars. Predict the shape of thehistogram of the number of cars sold each week. 
Correct Answer:
Verified
View Answer
Unlock this answer now
Get Access to more Verified Answers free of charge
Q42: According to the histogram, about how many
Q45: About what percentage of households own no
Q46: A used car salesman decides to track
Q47: Describe the shape of the distribution in
Q48: Which type of take- out food is
Q51: What percentage of college students preferred either
Q52: Report the mode for males and females.
Q55: Which group is more likely to spend
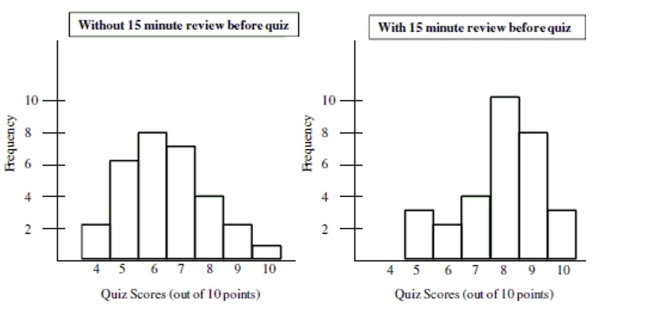
Q56: Compare and contrast the important similarities and
Q60: About how many of the swim courses
Unlock this Answer For Free Now!
View this answer and more for free by performing one of the following actions

Scan the QR code to install the App and get 2 free unlocks

Unlock quizzes for free by uploading documents