The figure shows a graph of the position x of two cars, C and D, as a function of time t. 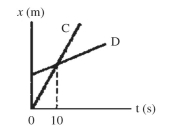 According to this graph, which statements about these cars must be true? (There could be more than one correct choice.)
A) At time t = 10 s, both cars have the same velocity.
B) The cars meet at time t = 10 s.
C) Both cars have the same acceleration.
D) The magnitude of the acceleration of car C is less than the magnitude of the acceleration of car D.
E) The magnitude of the acceleration of car C is greater than the magnitude of the acceleration of car D.
Correct Answer:
Verified
Q138: A ball is thrown downward in the
Q139: Suppose a ball is thrown straight up
Q140: Suppose that an object is moving with
Q141: The motions of a car and a
Q142: If the position versus time graph of
Q144: The graph in the figure shows the
Q145: The slope of a position versus time
Q146: The motion of a particle is described
Q147: An object is moving with constant non-zero
Q148: The graph in the figure shows the
Unlock this Answer For Free Now!
View this answer and more for free by performing one of the following actions

Scan the QR code to install the App and get 2 free unlocks

Unlock quizzes for free by uploading documents