The figure shows a graph of the resistance of a wire as a function of its length. What physical quantities does the slope of this graph represent?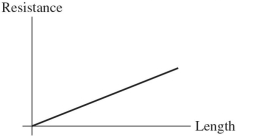
A) the product of the resistivity and the cross-sectional area of the wire
B) the reciprocal of the resistivity of the material
C) the cross-sectional area of the wire
D) the resistivity of the material of which the wire is made
E) the resistivity of the material divided by the cross-sectional area of the wire
Correct Answer:
Verified
Q1: For the graph shown in the
Q2: The length of a certain wire
Q3: Which one of the following quantities
Q5: A kilowatt-hour is equivalent to
A)
Q6: The figure shows conventional current passing
Q7: For the graph shown in the
Q8: The figure shows electrons passing through
Q9: Consider two copper wires with circular
Q10: A wire of resistivity @ must be
Q11: For the graph shown in the
Unlock this Answer For Free Now!
View this answer and more for free by performing one of the following actions

Scan the QR code to install the App and get 2 free unlocks

Unlock quizzes for free by uploading documents