The figure shows a graph of the power dissipated in a resistor as a function of the resistance. What quantity does the slope of this graph represent? 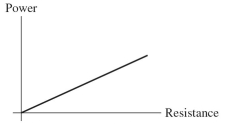
A) the square of the current in the resistor
B) the potential difference across the resistor
C) the reciprocal of the current in the resistor
D) the current in the resistor
E) the resistivity of the resistor
Correct Answer:
Verified
Q12: Copper wire #1 has a length
Q13: If a quantity you calculated has
Q14: If a quantity you calculated has
Q15: For the graph shown in the figure,
Q16: The length of a certain wire
Q18: For the graph shown in the
Q19: The length of a certain wire
Q20: You are given a copper bar
Q21: Over ordinary temperature ranges, the resistance
Q22: The current through a piece of
Unlock this Answer For Free Now!
View this answer and more for free by performing one of the following actions

Scan the QR code to install the App and get 2 free unlocks

Unlock quizzes for free by uploading documents