The figure shows a graph of the position x as a function of time t for a system undergoing simple harmonic motion. Which one of the following graphs represents the velocity of this system as a
Function of time? 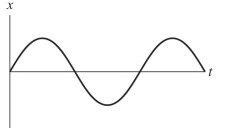
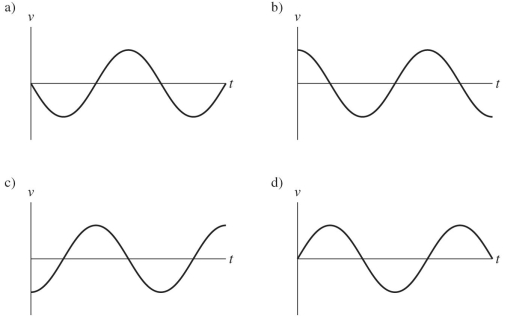
A) graph a
B) graph b
C) graph c
D) graph d
Correct Answer:
Verified
Q14: When a guitar is tuned to adjust
Q15: A string of mass m
Q16: Four waves are described by the following
Q17: The figure shows a graph of the
Q18: Four waves are described by the following
Q20: A ball swinging at the end of
Q21: The position of an air-track cart that
Q22: An object is oscillating on a spring
Q23: If the amplitude of the motion of
Q24: The quartz crystal in a digital watch
Unlock this Answer For Free Now!
View this answer and more for free by performing one of the following actions

Scan the QR code to install the App and get 2 free unlocks

Unlock quizzes for free by uploading documents