The figure shows a graph of the velocity v as a function of time t for a system undergoing simple harmonic motion. Which one of the following graphs represents the acceleration of this system as a Function of time? 
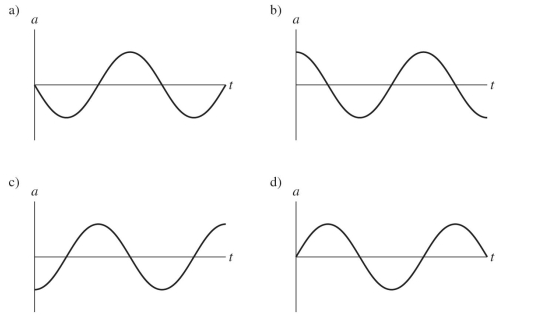
A) graph a
B) graph b
C) graph c
D) graph d
Correct Answer:
Verified
Q8: When a certain string is under tension
Q9: What is the frequency of the wave
Q10: The intensity of the waves from a
Q11: A simple harmonic oscillator oscillates with frequency
Q12: An object that hangs from the ceiling
Q14: When a guitar is tuned to adjust
Q15: A string of mass m
Q16: Four waves are described by the following
Q17: The figure shows a graph of the
Q18: Four waves are described by the following
Unlock this Answer For Free Now!
View this answer and more for free by performing one of the following actions

Scan the QR code to install the App and get 2 free unlocks

Unlock quizzes for free by uploading documents