Use the circle graph to solve the problem.
-A survey of the 5589 vehicles on the campus of State University yielded the following pie chart. 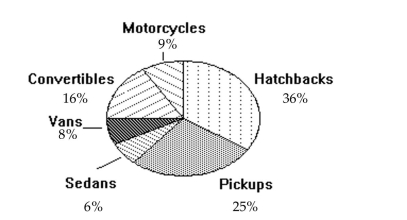 What percent of the vehicles are hatchbacks?
A) 201%
B) 8%
C) 36%
D) 25%
Correct Answer:
Verified
Q51: Construct the cumulative frequency distribution that
Q52: Find the original data from the
Q53: Use the circle graph to solve the
Q54: Use the circle graph to solve the
Q55: Solve the problem.
-The frequency table below
Q57: Solve the problem.
-The data shows the
Q58: Find the original data from the
Q59: Construct the cumulative frequency distribution that
Q60: Find the original data from the
Q61: Solve the problem.
-The Kappa Iota Sigma Fraternity
Unlock this Answer For Free Now!
View this answer and more for free by performing one of the following actions

Scan the QR code to install the App and get 2 free unlocks

Unlock quizzes for free by uploading documents