Solve the problem.
-At the National Criminologists Association's annual convention, participants filled out a questionnaire asking what they thought was the most important cause for criminal behavior. The tally was as follows. Make a Pareto chart to display these findings.
A) 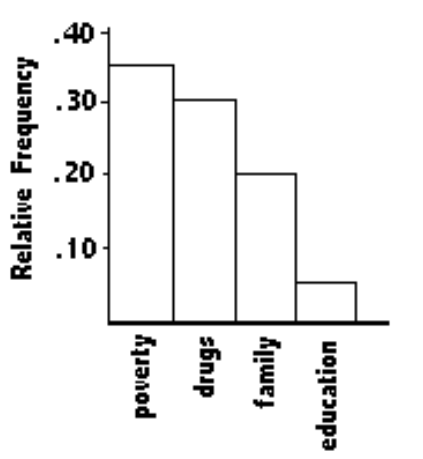
B) 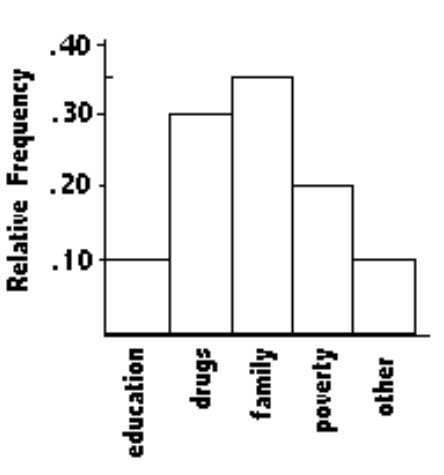
C) 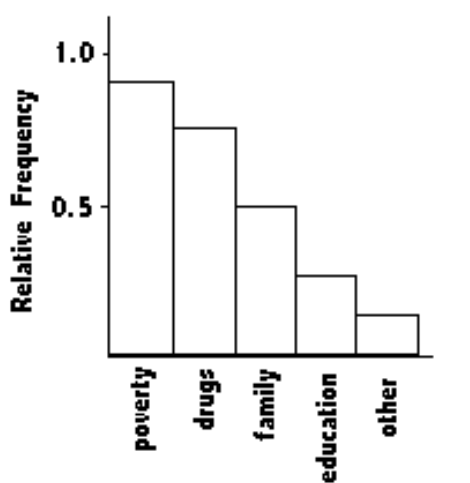
D) 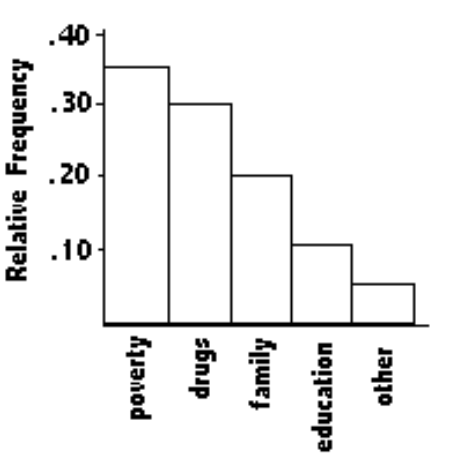
Correct Answer:
Verified
Q57: Solve the problem.
-The data shows the
Q58: Find the original data from the
Q59: Construct the cumulative frequency distribution that
Q60: Find the original data from the
Q61: Solve the problem.
-The Kappa Iota Sigma Fraternity
Q63: Construct a pie chart representing the
Q64: Construct the dot plot for the
Q65: Construct the dot plot for the
Q66: Use the data to create a
Q67: Construct a pie chart representing the
Unlock this Answer For Free Now!
View this answer and more for free by performing one of the following actions

Scan the QR code to install the App and get 2 free unlocks

Unlock quizzes for free by uploading documents