Use the given process data to construct a control chart for p
-A control chart for R is shown below. Determine whether the process variation is within statistical control. If it is not, identify which of the three out-of-control criteria lead to rejection of statistically stable variation. 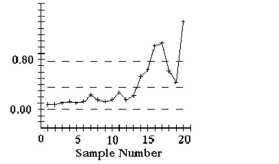
Correct Answer:
Verified
View Answer
Unlock this answer now
Get Access to more Verified Answers free of charge
Q27: Use the given process data to
Q28: Solve the Problem.
-A control chart for attributes
Q29: Use the given process data to
Q30: Use the given process data to construct
Q31: Use the given process data to
Q33: Use the given process data to construct
Q34: Use the given process data to construct
Q35: Use the given process data to
Q36: Use the given process data to
Q37: Use the given process data to construct
Unlock this Answer For Free Now!
View this answer and more for free by performing one of the following actions

Scan the QR code to install the App and get 2 free unlocks

Unlock quizzes for free by uploading documents