A normal quartile plot is given below for the weekly incomes (in dollars)of a sample of
engineers in one town. Describe what each x value represents and what each y value
represents. Use the plot to assess the normality of the incomes of engineers in this town.
Explain your reasoning. 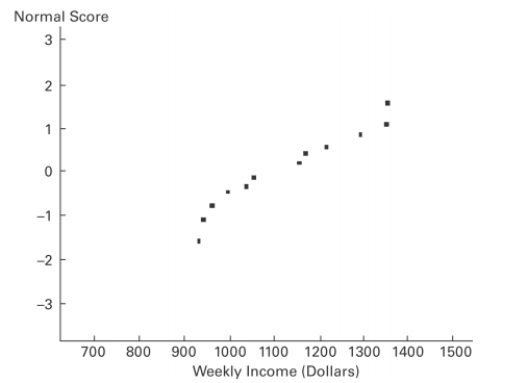
Correct Answer:
Verified
View Answer
Unlock this answer now
Get Access to more Verified Answers free of charge
Q22: The Precision Scientific Instrument Company manufactures thermometers
Q36: If
Q38: A normal quartile plot is given below
Q38: The weights of college football players are
Unlock this Answer For Free Now!
View this answer and more for free by performing one of the following actions

Scan the QR code to install the App and get 2 free unlocks

Unlock quizzes for free by uploading documents