Use Normal Probability Plots to Assess Normality
-Determine whether the following normal probability plot indicates that the sample data could have come from a population that is normally distributed. 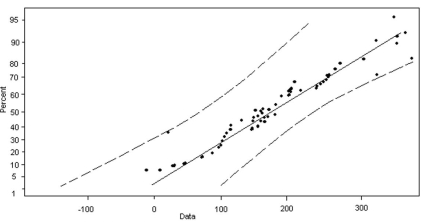
A) normally distributed
B) not normally distributed
Correct Answer:
Verified
Q82: Use Normal Probability Plots to Assess
Q83: Find and Interpret the Area under
Q84: Find the Value of a Normal Random
Q85: Find the Value of a Normal
Q86: Find the Value of a Normal Random
Q88: Find and Interpret the Area under
Q89: Use Normal Probability Plots to Assess
Q90: Find the Value of a Normal Random
Q91: Find the Value of a Normal Random
Q92: Find the Value of a Normal Random
Unlock this Answer For Free Now!
View this answer and more for free by performing one of the following actions

Scan the QR code to install the App and get 2 free unlocks

Unlock quizzes for free by uploading documents