Use Normal Probability Plots to Assess Normality
-Determine whether the following normal probability plot indicates that the sample data could have come from a population that is normally distributed. 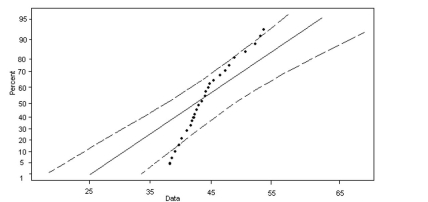
A) not normally distributed
B) normally distributed
Correct Answer:
Verified
Q88: A normal probability plot is a graph
Q106: Approximate Binomial Probabilities Using the Normal Distribution
-Find
Q107: Approximate Binomial Probabilities Using the Normal Distribution
-A
Q108: Approximate Binomial Probabilities Using the Normal
Q108: A student answers all 48 questions on
Q110: Approximate Binomial Probabilities Using the Normal Distribution
-In
Q112: Approximate Binomial Probabilities Using the Normal Distribution
-A
Q113: Approximate Binomial Probabilities Using the Normal Distribution
-According
Q114: Approximate Binomial Probabilities Using the Normal Distribution
-In
Q116: Approximate Binomial Probabilities Using the Normal
Unlock this Answer For Free Now!
View this answer and more for free by performing one of the following actions

Scan the QR code to install the App and get 2 free unlocks

Unlock quizzes for free by uploading documents