Use Normal Probability Plots to Assess Normality
-Determine whether the following normal probability plot indicates that the sample data could have come from a population that is normally distributed. 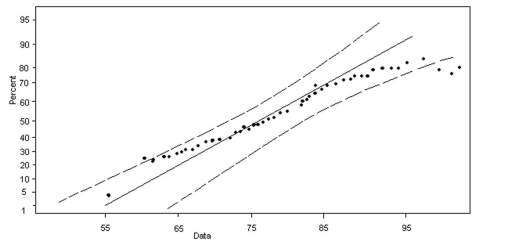
A) not normally distributed
B) normally distributed
Correct Answer:
Verified
Q98: Find the Value of a Normal Random
Q99: Find the Value of a Normal Random
Q100: Find the Value of a Normal Random
Q101: Approximate Binomial Probabilities Using the Normal Distribution
-A
Q102: Approximate Binomial Probabilities Using the Normal Distribution
-The
Q105: Approximate Binomial Probabilities Using the Normal Distribution
-A
Q106: Approximate Binomial Probabilities Using the Normal Distribution
-Find
Q107: Approximate Binomial Probabilities Using the Normal Distribution
-A
Q108: Approximate Binomial Probabilities Using the Normal
Q111: The author of an economics book has
Unlock this Answer For Free Now!
View this answer and more for free by performing one of the following actions

Scan the QR code to install the App and get 2 free unlocks

Unlock quizzes for free by uploading documents