The scatter diagram shows the relationship between average number of years of education and births per woman ofchild bearing age in selected countries. Use the scatter plot to determine whether the statement is true or false.
-There is a causal relationship between years of education and births per woman. 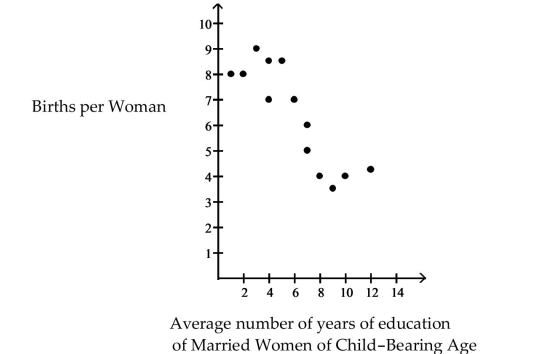
A) False
B) True
Correct Answer:
Verified
Q22: A history instructor has given the same
Q30: The scatter diagram shows the relationship between
Q31: Choose the one alternative that best
Q33: Write the word or phrase that
Q34: Provide an appropriate response.
-Calculate the linear
Q36: Write the word or phrase that
Q37: Choose the one alternative that best completes
Q37: A scatter diagram locates a point in
Q38: Provide an appropriate response.
-Calculate the linear
Q40: Write the word or phrase that
Unlock this Answer For Free Now!
View this answer and more for free by performing one of the following actions

Scan the QR code to install the App and get 2 free unlocks

Unlock quizzes for free by uploading documents