The pie chart shows the percentage of votes received by each candidate in the student council presidential election. Use
the pie chart to answer the question.
-Student Council President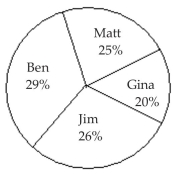
300 total votes Who got the most votes
A) Ben
B) Jim
C) Matt
D) Gina
Correct Answer:
Verified
Q12: Retailers are always interested in determining
Q13: Relative frequency is the proportion (or
Q14: The 1995 payroll amounts for all
Q15: Use the graph to answer the
Q16: Use the graph to answer the question.
Q18: The sum of all the relative frequencies
Q19: Use the graph to answer the question.
Q20: The results of a survey about
Q21: The pie chart shows the percentage
Q22: Construct Histograms of Continuous Data
-
Unlock this Answer For Free Now!
View this answer and more for free by performing one of the following actions

Scan the QR code to install the App and get 2 free unlocks

Unlock quizzes for free by uploading documents