Describe What Can Make a Graph Misleading or Deceptive
-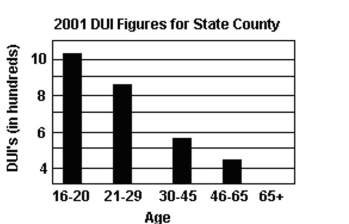
A) The graphic may give the impression that drivers over age 65 had no DUI's in
B) The graphic only includes information for one year.
C) The horizontal scale does not begin at zero.
D) The graphic is not misleading.
Correct Answer:
Verified
Q63: Create Cumulative Frequency and Relative Frequency
Q64: Describe What Can Make a Graph Misleading
Q65: Create Cumulative Frequency and Relative Frequency
Q66: Create Cumulative Frequency and Relative Frequency
Q67: Create Cumulative Frequency and Relative Frequency
Q69: Create Cumulative Frequency and Relative Frequency
Q70: Create Cumulative Frequency and Relative Frequency
Q71: Draw Time-Series Graphs
-The data below represent
Q72: Draw Time-Series Graphs
-Women were allowed to
Q73: Describe What Can Make a Graph Misleading
Unlock this Answer For Free Now!
View this answer and more for free by performing one of the following actions

Scan the QR code to install the App and get 2 free unlocks

Unlock quizzes for free by uploading documents