Describe What Can Make a Graph Misleading or Deceptive
-The following graph shows the number of car accidents occurring in one city in each of the years 2001 through 2006. The number of accidents dropped in 2003 after a new speed limit was imposed. How is the bar graph misleading How would you redesign the graph to be less misleading 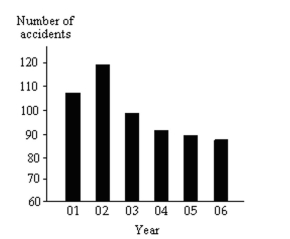
Correct Answer:
Verified
View Answer
Unlock this answer now
Get Access to more Verified Answers free of charge
Q56: Identify the Shape of a Distribution
-
Q57: Draw Stem-and-Leaf Plots
-The March utility bills
Q58: Draw Stem-and-Leaf Plots
-The scores for an
Q59: Identify the Shape of a Distribution
-
Q62: The class midpoint can be determined by
Q63: Create Cumulative Frequency and Relative Frequency
Q64: Describe What Can Make a Graph Misleading
Q65: Create Cumulative Frequency and Relative Frequency
Q66: Create Cumulative Frequency and Relative Frequency
Q68: An ogive is a graph that represents
Unlock this Answer For Free Now!
View this answer and more for free by performing one of the following actions

Scan the QR code to install the App and get 2 free unlocks

Unlock quizzes for free by uploading documents