Construct and Interpret Confidence Intervals about the Population Mean Difference of Matched -Pairs Data
-Seven randomly selected plants that bottle the same beverage implemented a time management program in hopes of improving productivity. The average time, in minutes, that it took the companies to produce the same quantity of bottles before and after the program are listed below. Assume the two population distributions are normal. Construct a confidence interval for . Assume that the paired data came from a population that is normally distributed.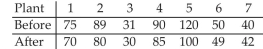
A)
B)
C)
D)
Correct Answer:
Verified
Q19: Two samples are said to be dependent
Q20: Test Hypotheses Regarding Matched-Pairs Data
-Nine students
Q21: Construct and Interpret Confidence Intervals about
Q22: Test Hypotheses Regarding the Difference of
Q23: Test Hypotheses Regarding the Difference of
Q25: Construct and Interpret Confidence Intervals about
Q26: Test Hypotheses Regarding the Difference of
Q27: Test Hypotheses Regarding the Difference of
Q28: Test Hypotheses Regarding the Difference of
Q29: Test Hypotheses Regarding the Difference of
Unlock this Answer For Free Now!
View this answer and more for free by performing one of the following actions

Scan the QR code to install the App and get 2 free unlocks

Unlock quizzes for free by uploading documents