The bar charts below depict the veteran statuses of Americans, separated by gender. Which bar chart has more variability in veteran status? Why? 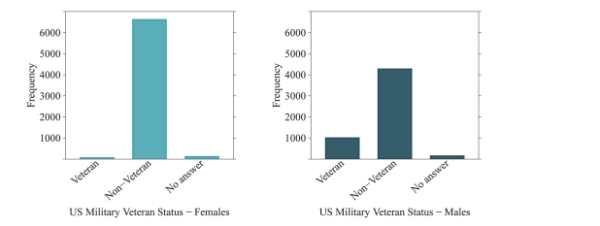
A) The female bar chart shows more variability because many of the observations fall into one category ("Non-Veteran") .
B) The female bar chart shows more variability because there are more observations in the different categories than there are for males.
C) The male bar chart shows more variability because many of the observations fall into one category ("Non-Veteran") .
D) The male bar chart shows more variability because there are more observations in the different categories than there are for females.
Correct Answer:
Verified
Q40: According to the word cloud, which is
Q41: Which histogram represents the same data as
Q42: What is the difference between a histogram
Q43: Which of the following would likely show
Q44: for following questions , match one of
Q46: In the following histogram, what can you
Q47: The following histogram represents audience movie ratings
Q48: Use the following information to answer questions
Q49: What is the difference between a bar
Q50: What information is NOT explicitly portrayed in
Unlock this Answer For Free Now!
View this answer and more for free by performing one of the following actions

Scan the QR code to install the App and get 2 free unlocks

Unlock quizzes for free by uploading documents